You want to promote your business on social.
You’ve looked into the various platforms and read articles describing the benefits of each. But how are you supposed to know which one will give you the greatest return on your dollar?
Twitter, Facebook, LinkedIn, Youtube – they all extend the reach of your message to new audiences.
In fact, a recent study by AOL found that marketers that allocate ad dollars to social channels see a 25% increase in sales from advertising compared to those from organic, non-paid touchpoints.
But with different functions, audiences, and costs you need to know which social ad platform is worth your investment. Here are 20 stats to break down which platform is right for your audience and your business’ needs. Plus we’ve included a comparison chart at the end to make your social ad analysis a little bit easier.
Facebook Advertising
Facebook gets a gold star when it comes to its reach. At the end of 2014 the platform has over 1.35 billion monthly users and 864 million daily users. Not too shabby.
Many people were skeptical whether Facebook Ads would actually catch on and become mainstream when they launched in 2008. But in reality, today it’s hard to find a business who hasn’t tried out the platform. Facebook Ads give businesses the potential reach of 43.8% of all internet users.
But, massive audience to the side, here are 6 stats on Facebook Ads that you should know:
-
A recent 2014 study showed Facebook Ads having a 10% conversion rate (second only to Youtube) when the user interacted with zero other sources for the introduction of a product. This means nothing else influenced the user’s path to conversion.
-
69% of the time, Facebook is used as a middle touch point, meaning it rarely closes a sale on its own but has a strong impact on awareness and customer research.
-
Facebook Ads have an average CPM (cost per 1000 impressions) of $0.59 and an average CPC (cost per click) of $0.50.
-
For click-through rate, Facebook Ads average 0.119%.
-
Facebook Ads experience huge swings in costs and revenue based on industry. The gaming industry, for example, sees a 40% lower cost than average and a 30% higher click- through rate.
-
In terms of mobile, for the first three quarters of 2013, Facebook’s RPC (revenue per click) on iOS averaged 6.1 times higher than Android and ROI on iOS averaged 17.9 times higher than Android.
Twitter Advertising
Twitter has 284 million active monthly users that send 500 million tweets each and every day. While it doesn’t have quite the reach of Facebook its ad platform does have its own advantages.
Twitter advertising allows you to gain visibility with promoted tweets or trends in the user’s timeline (below left), to grow your followers with promoted accounts (below right), and to focus on lead generation with Twitter lead generation cards.
The following are 6 stats on Twitter advertising for businesses:
-
A June 2014 study showed that 80% of US marketers were using promoted tweets, up 44% from 2013.
-
The average cost per impression (CPM) is $3.50, obviously a higher cost than the Facebook platform.
-
Promoted tweets saw an average cost-per-click (CPC) of $0.29 in 2014, with a CTR or engagement rate of 1-3%.
-
While it experiences a higher CTR than Facebook, the revenue per visitor is only $0.44 to Facebook’s $ 0.93.
-
Promoted Trends on Twitter provide a 22% lift in brand conversion, a 30% lift in positive mentions and a 32% lift in retweets, but they can come at a cost of more than $200,000 a day.
-
Twitter ads are in a good spot to dominate ad revenue with their improved design, but as of 2013 only made up 1.85% of the mobile ad market share.
LinkedIn Advertising
LinkedIn Ads is a self-service advertising option where you get to create your own ads and place them on different pages of the LinkedIn website (which now has over 300 million active monthly users). People that click through your ads are taken to your website. Aside from small display ads you can also do rich-media display ads, targeted InMail, and polls.
Like Facebook you can select a target audience based on age, gender, position, company name, etc. You get to set the budget and pay for clicks or impressions. Many companies like LinkedIn for advertising because it gives you easy access to professionals and companies seeking your products or services, rather than the general public.
Here are 4 stats on LinkedIn Advertising for business:
-
65% of B2B companies have acquired a customer by using LinkedIn and its ad features.
-
LinkedIn ads have a minimum cost per click (CPC) of $ 2 and run up to $ 4 or $ 5 per click depending on your click-through rates.
-
LinkedIn claims a good click through rate to be 0.025%, but most would say anywhere between 0.08% and 0.1% you’re doing great.
-
In 2014, LinkedIn experienced a large growth in revenue from advertising, up 45% from 2013. Advertising actually accounted for 19% of the company’s revenue

Youtube Advertising
Behind Google, YouTube is the second-largest search engine in the world with more than 1 billion unique users each month. Obviously advertisers have caught on and Youtube presents a great opportunity to boost your web presence to a targeted audience.
There are currently four types of Youtube ads including:
- in-search ads (above the search results)
- in-slate ads (suggested videos after the one you just watched)
- in-display ads (suggested videos beside the video you’re watching)
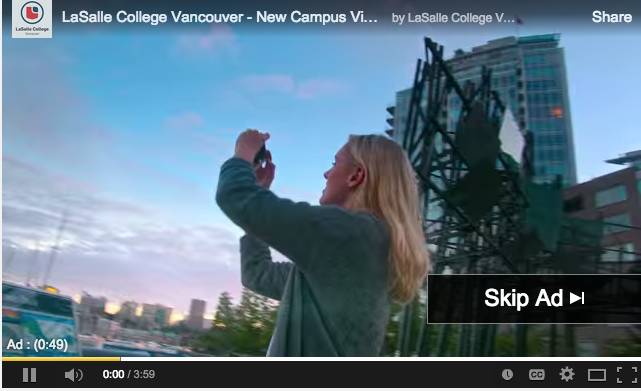
- in-stream ads (an ad plays before you watch your video, as seen below)

Lets look at some Youtube advertising stats:
-
98 of AdAge’s Top 100 advertisers have run campaigns on YouTube.
-
On average Youtube ads run a cost-per-view (same as CPC) between $0.10-$0.30 depending on the type of ad you choose.
-
Youtube has been proven to be the most effective social ad platform for introducing new products and influencing buying decisions. In 2014 it had a 14% conversion rate when the user interacted with no other sources of information on a product and 18% conversion rate when they may have interacted with other sources, but Youtube introduced the product.
-
In-stream Youtube ads delivered a 4.5x higher CTR compared to flash banner ads and 2.7x higher than rich media ads.
Obviously Youtube ads are a strong contender in the social ad game and need to be considered when designing your strategy.
So, what’s best?
- YouTube is best for introducing and selling products
- Facebook is best for expanding highly targeted brand awareness
- Twitter is best for product promotion in the middle stage of the buying process
- LinkedIn is best for B2B businesses to acquire new and qualified leads.
We chose not to include ROI in our comparison as every business will have a different price point. Because of this, a click-through for one business may be worth a couple dollars. For another it may be worth more than a hundred. To determine your business’ advertising ROI, check our recently released guide to calculating the true value of your customers.
Related Content:
- How to Calculate the True Value of your Customers
- Ebook: The Ultimate Guide to Boosting Your Social Media ROI
- Increase Social Media ROI With Contests & Promotions
– Written by Claire Grayston
Claire is a digital content marketer at Wishpond. When not racking her brain for new content, you’ll find her hiking or snowboarding the local Vancouver mountains.

