
![]()
Being on social for the sake of ‘being on social’ isn’t cutting it nowadays. If you expect to be a qualified social media ‘go to’ you have to be delivering measurable results.
But how do you do it?
Sure, Twitter, Facebook and Linkedin all have their own analytics platforms but none of them show you the dollar values of the hours you’re devoting.
This article is going to show you, step-by-step, how I track Wishpond’s social media accounts and show real-world returns.
Check it out!

Setting up tracking
Google Analytics allows you to set up UTM tracking codes for your website.
UTM (which, oddly, stands for Urchin Tracking Module) codes are one of the most important parts of my social media arsenal. They allow Google Analytics to “see” how much engagement any particular link has had.
I’m going to show you here how I set one up.
Choose a website you’d like to track.
One of the main responsibilities I have is getting readership from social media to the Wishpond blog. Each day that we publish content I take the specific URL from the article and get tracking codes for the major social media publishers: Google+, Twitter, Linkedin and Facebook.
![]()
For that post the URL would be: https://blog.wishpond.com/post/112232945372/content-convo-podcast-on-personality-and-tone-in
Go to URL builder
When you go to the URL builder website it will look like a standard Google FAQ page. Don’t fret. Just scroll half-way down the page and you will come across a box like this:
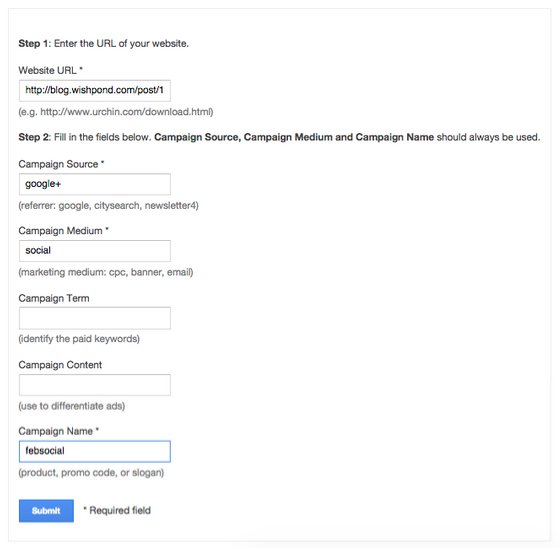
There are 4 mandatory boxes that you need to fill out:
-
Website URL: This is the URL that you’re looking to track the engagement of. For me it’s an individual blog article (like the one above). For you, it could be a landing page, product page, homepage or piece of content you’re promoting on social (whatever it is you want to track the social engagement of).
-
Campaign source: The campaign source is where you’re posting it. There are four campaign sources I use: google+, linkedin, twitter and facebook (but it could be any traffic source).
-
Campaign medium: This is what category your ‘source’ falls into. Google+ and Linkedin are part of a social medium. A Google Ad might be “PPC” or “Banner”. A link in an email would be “email”, etc.
-
Campaign name: This is totally your call for what you’d like to name your campaign. It’s something that will be a unique identifier for your campaign. I called mine “febsocial” for the month of February as not only am I tracking social in February. In March, I’ll change it to “marsocial” so that I’m easily able to compare month-to-month.
Shorten the link through Bit.ly
After you’ve filled out all of the boxes you’re going to get a long URL that includes the original URL and a ton of extra tracking courtesy of Google.
It’s gonna look like this: https://blog.wishpond.com/post/112232945372/content-convo-podcast-on-personality-and-tone-in?utm_source=google%2B&utm_medium=social&utm_campaign=febsocial
Not very pretty, right?
Therefore you need to shorten your link. You can do this using whichever link shortener you prefer but the one I use is Bit.ly, which takes the code you saw previously and turns it into this: https://bit.ly/17DIslb
Create a spreadsheet
Now that you have all of your links you can place them into a spreadsheet. This gives me the ability to see all of the links I’ve tracked over a given month and then refer to the dates that there was more activity. It’s also good to have them all in a spreadsheet so you don’t mix up the links.
![]()
Once you have the links you can post to social!
Check out what’s happening in your Google Analytics
Go to Google.com/Analytics and in the top right corner click “Access Google Analytics.”
Since I’m tracking our blog I am accessing the “Blog” for Google Analytics purposes.
I’m brought to this page:
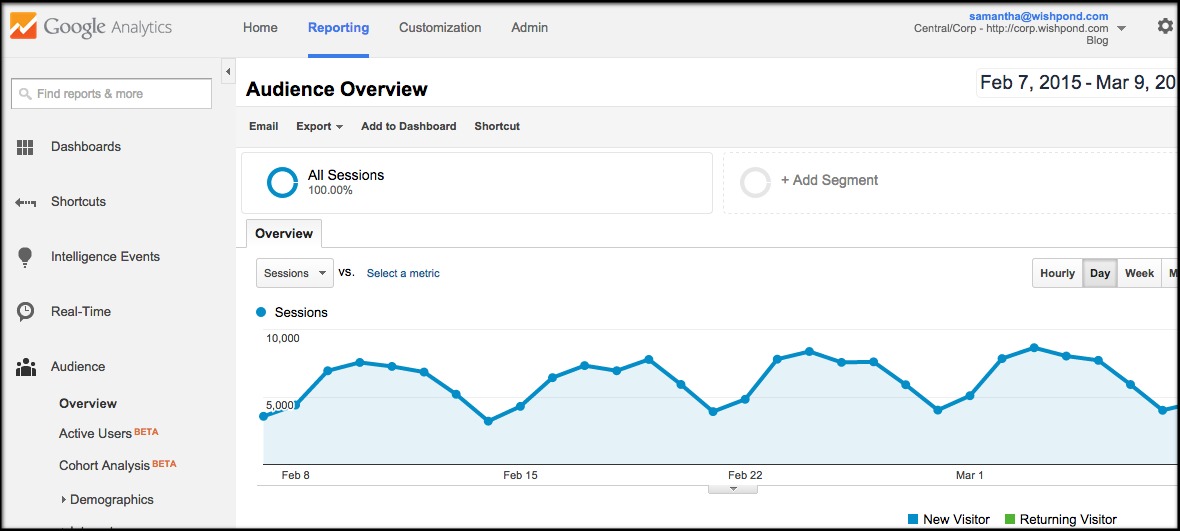
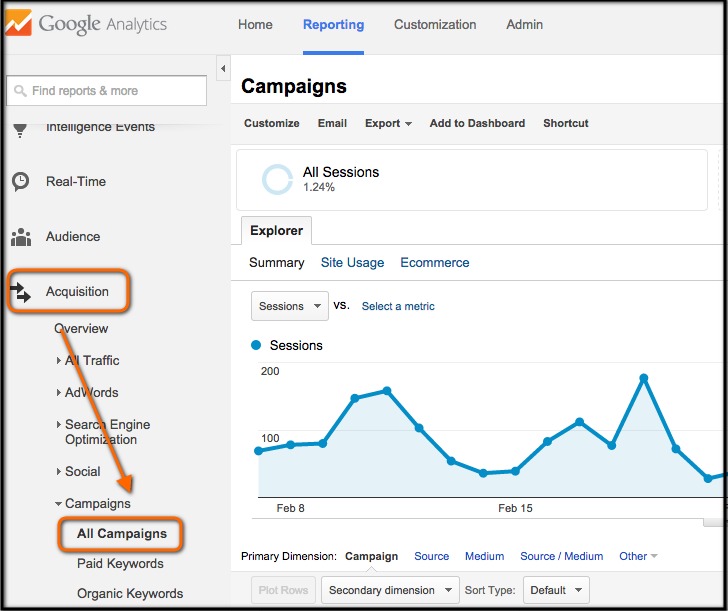
On the right side scroll down to “Acquisition.”
When you select “Acquisition” you will have the option “Campaign.” Selecting “Campaign” will show you all of the campaigns you currently have running.
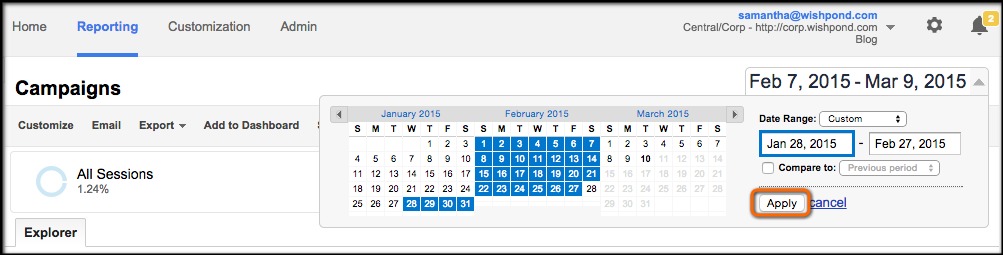
You can set the dates you’d like to see in the top right corner.
For “febsocial” I’m going to select the past week and click “apply.”
It gives me a graph that looks like this:
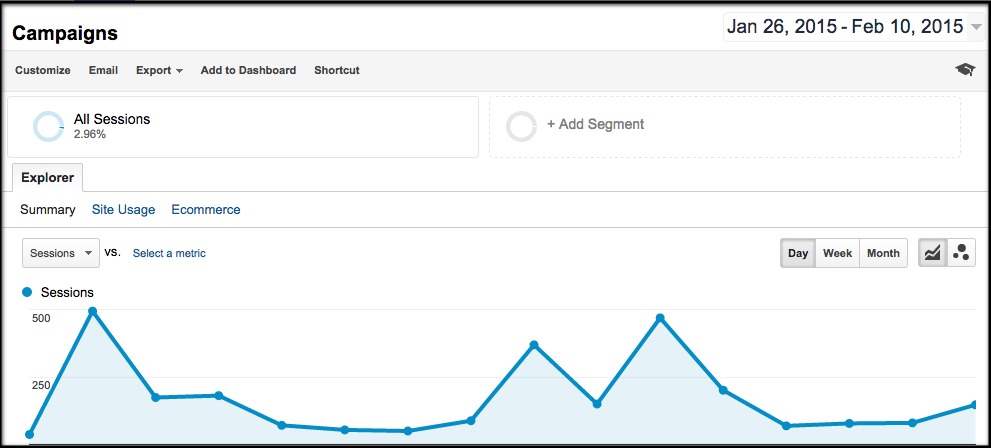
As you can see the highest amount of visitors from social to the blog were last Thursday with 139 sessions.
You are also able to look at the individual traffic sources:
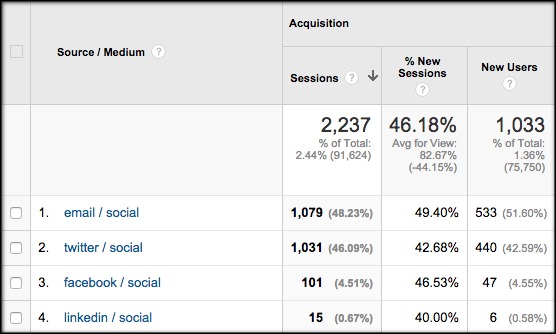
So now I can take this data to my boss and say, “See? I doubled Twitter engagement in the past month!” Or, “Posts on Facebook with video drive substantially more traffic to the Wishpond blog than image posts!” Or, “We should probably focus our resources on email and Twitter.”
Conclusion
Tracking your social with UTM codes allows you to see which social media sources and posts are driving the most traffic to your blog, landing page, ads, product pages, etc.
Hopefully this walkthrough has given you enough to start tracking your own social efforts.
How do you track your social media strategy?