

You can’t measure social media ROI, can you? You can’t get metrics to measure the success of blogging and inbound marketing, can you?
I cringe when I hear businesses ask me this. Social media, email, and websites are filled with numbers, metrics and trackable actions. There are tons of ways to get analytics, and tons of ways to use them to improve your business results. (Entire libraries have been written about the subject.)
The key to using analytics is knowing the Key Performance Indicators (KPIs) you need, how to best track them, and then actually using your data to keep improving. You’ll generate a far more effective content marketing strategy, improve your SEO, and get more traffic on your blog.
In this article, I give you bite-sized methods of tracking your metrics, and how to use your analytics to get results.
Tweetable Takeaways
(Click to tweet)
- Get better ROI with Google Analytics. Find out how…
- Track results from social media referrals to every blog post you write
- Do you use UTM codes in your bitly links? Why you should…
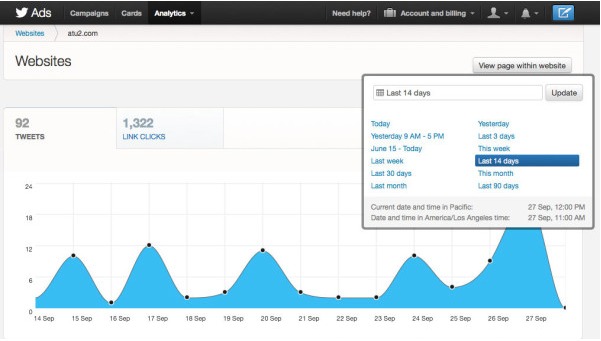
- Do you use Twitter Analytics yet?
- Be a good marketer – monitor your results regularly and continuously improve
Google Analytics
Google analytics are incredibly robust. But, if you aren’t spending a good chunk of your day on them everyday, they can be a bit overwhelming. I’ll simplify this data powerhouse for you, by giving you what you need to measure and how to measure it.
As a content marketer, you need specific data – not every piece of data. Your goal is to increase your ROI, and drive the most (and best) traffic to your site. With real-time analytics, you can quickly sharpen your strategies to get the most benefit for your cost – and improve your profits.
The key to Google Analytics is to know what you need to measure, and how to find it.
Here are the most important KPI’s (Key Performance Indicators) to measure for your blog traffic:
- Social Media Traffic referral
- Unique Visitors
- Pageviews
- Pages/ Visit
- Average time on site
- Bounce Rate
I’ll now talk about what each of these KPI’s mean, and why you need to be tracking each of these metrics to improve your bottom line.
Social Media Traffic Referral
When you are measuring results from social media sources, your Social Media Traffic Referrals are the key metrics to watch. Google added social analytics in 2012, and it enables you to track all of your engagement levels from your social network referrals.
This is very cool, as you can set this up to track traffic from the sites you, as a company, are using to drive readers to your blog. You (or your tech team) can, for example, set up your Google analytics to track traffic from Facebook, Twitter, Google+ Reddit, Quora, and tons of other sites you want to use.
You can set it up to track your Pageviews, Pages/ Visit and Average times on site, for your traffic from each of your social networks.
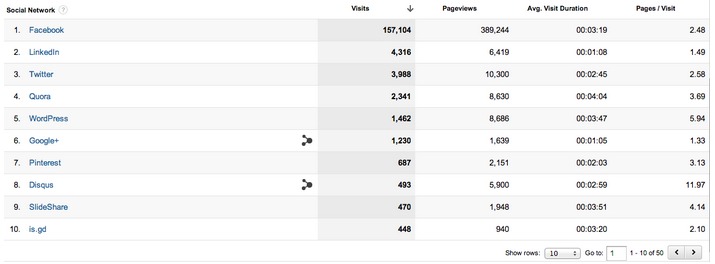
Here is an example of Social Media Traffic Referral. It’s set up to track traffic from 50 social sites, including reddit and even paper.li. Use it in spreadsheet format, and/or in the more visual graph – depending on your metric needs.
Unique Visitors
Your Unique Visitors is the second best metric to measure your blog traffic. It’s the number of individual people who click on to your site. It does not count the same person if they visit your site the next day, for example. Most analytics measure this based on visitors’ IP addresses.
Pageviews
This can indicate which blog articles are getting the most traffic. Pageviews are the number of times a particular page on your site is viewed. This is cool to track, as you can tailor your future articles to be like your more popular ones.
Pages/Visit
This is an important measurement, as it tracks the number of pages each visitor is looking at on your site. Combine this with other metrics, like social media traffic, and you can measure what sites bring in the most interested readers (and potential customers).
Average Time on Page
You also want to pay attention to the time spent on your site. More views on your pages for a longer time plays a role in your SEO. It also indicates what articles are getting the most reader attention, and what social sites you get the longest views from.
Bounce Rate
This is another key metric, particularly for tracking your sales funnel success. It’s related to your Pages/Visit, as the Bounce Rate gives you the percentage of visitors who only click on one page of your site. Basically, the higher your bounce rate, the worse it is. A high bounce rate could be lowered with more interesting links to internal pages, more cool links on your site, or determining what demographic has a low bounce rate and reaching more of them!
Landing Pages: Putting your Social Metrics Together
You can track specific [landing pages(https://www.wishpond.com/landing-pages) (like each blog article) through Google analytics. This is yet another incredibly powerful measurement and it is the key measurement tool to use for tracking results in your social media marketing.
Landing page metrics are available for Social Referrals (i.e. traffic from social media). This means you can track all of your traffic coming from social sites, and what blog articles are generating the most success.
Use your landing page data to see your most popular blog articles, measure specifics on how long visitors stay on your site and their activity, and see where you’re getting your blog article traffic from.
Are you getting traffic from Facebook, Twitter, Pinterest, LinkedIn, Google+, Instagram, or other sources? Are they good quality traffic sources?
Landing Page reports can measure:
- Unique Visitors
- Pageviews
- Average Time on Page
- Pages/ Visit
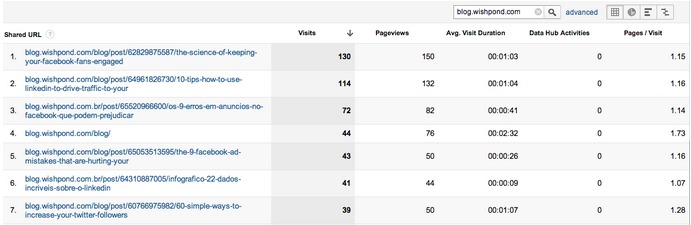
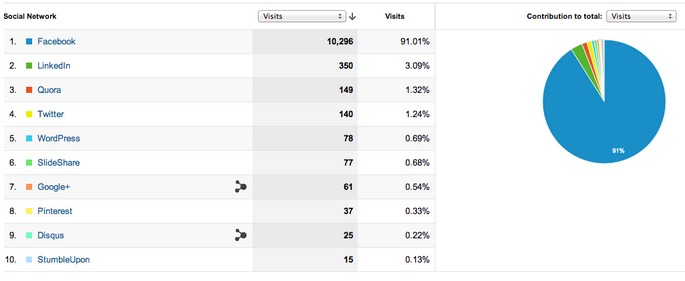
Here’s an example from the Wishpond blog. Today, our most popular blog article was “ The Science of Keeping your Facebook Fans Engaged”.
We had 130 unique visitors, and 150 views of the articles. People spent an average of 1 minute and 3 seconds on the site, and they visited 1.15 pages (in other words, they visited the article page, and an average of .15 other pages).
To get more info about where traffic for our article came from, I just clicked on the article link, and Google shows me the graph below. This indicates the majority of views came from Facebook (96 unique visitors), and people directed from Facebook spent the most time on our site (1:22 minutes)
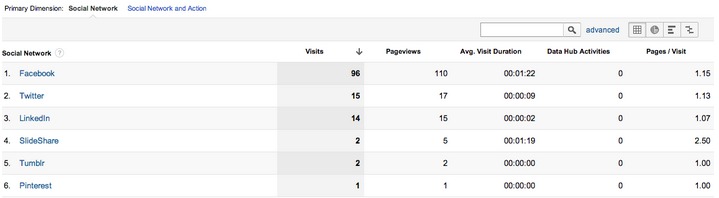
We can use this data to sharpen our inbound marketing tactics. Clearly, Facebook is our best method to drive traffic.
Based on these metrics, we can, for example:
- increase our Facebook posts
- run more Facebook ads
- increase links on Twitter and LinkedIn
- be more engaging on Slideshare to increase visitors
What do you think? What other tactics could we do to increase Visitors, Time on Site and Pages/Visit?
As you delve further into Google Analytics, you can learn to use it for tons of SEO improvements, financial benefits for your business, and a whole lot more.
Read more about Google Analytics:
- Google Analytics
- Avinash Kaushik
- Moz.com Google Analytics
- KissMetrics 50 Resources for Google Analytics
You can even go for full Google Analytics Certification:
Other Analytics
I thought I’d include a few other methods to get your analytics from. It is, afterall the internet we’re talking about – and it’s all based on numbers when you get right down to it. There’s no shortage of getting the metrics you need for your business.
I’ll talk about link shorteners, and what you can do with them. I’ll also talk about social media platform metrics – that you can get directly from your social sites.
Link Shorteners
Link shorteners not only make your links look better, they give you analytics too. You can track click through rates for each of your inbound marketing links. You can see overall trends for what topics are being click on where. You can even see the results of your competitors shortened links too!
Bitly
The most popular (and easy to use) link shortener is Bitly.
Use bitly shorteners to track the clickthroughs to your blog, and measure what methods drive the most traffic to your site.
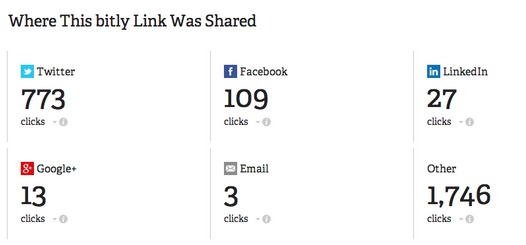
You can track where your link was clicked on from most popular social sites, as well as email, and shares. Use this data as you would Google Analytics. Check out what sites are getting the most clickthroughs for your links. Strategize and tweak your marketing tactics to increase your clicks.
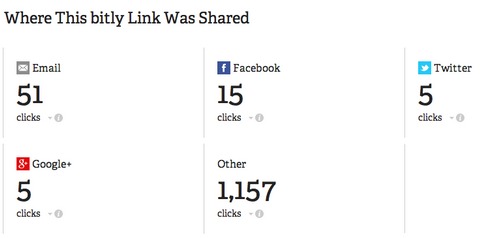
In this example, our most clicks came from “Other”, then Email and Facebook. When I clicked on Other, it showed most of these clicks were from email too.
Clearly, email is good method for us to reach our readers, and drive traffic to our blog.
Competitors Links on Bitly
Use bitly to check out your competitors blog articles. Simply copy and then paste their blog URL.
Here’s an example of the Google Analytics URL. You can see it’s been clicked on through the bitly link shortener 2,677 times.
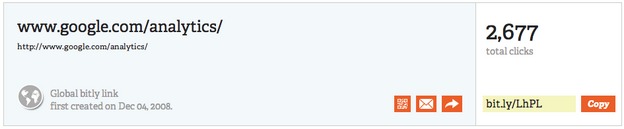
It’s been most shared on “Other” and Twitter:
UTM Tracking Codes
Another, more advanced, tactic for link shorteners is UTM Tracking Codes.
These codes let you add custom campaign parameters to your URL’s. Basically, this means you can link to the same blog post, but you can set up different campaign sources, mediums and names to better track your specific campaign metrics.
Google’s URL Builder makes your UTM generation super simple:
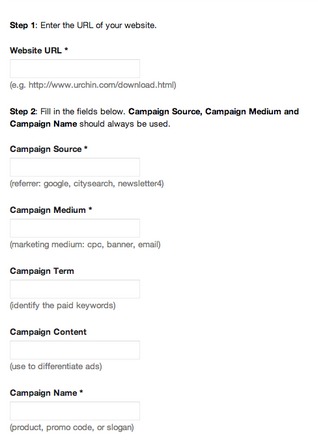
Fill in:
- your blog landing page
- your source (such as what site you’re linking on – ie Facebook or Quora, etc)
- your medium (such as “contentmarketing” or “organic”)
- your name (if your links are part of a strategic marketing plan, use a common name, etc.)
Track your click through rates for each link you use. UTM codes work amazingly well for tracking your links to more obscure sites (such as Reddit, and other social bookmarking sites), or even for tracking links for various inbound marketing strategies you need to test.
For example, you could test traffic results from links on Quora, forums, and social bookmarking site.
Set up a three UTM codes, with different sources. Keep your medium and name the same:
- https://blog.wishpond.com/? utm_source=quora &utm_medium=cm&utm_campaign=nov
- https://blog.wishpond.com/? utm_source=forums &utm_medium=cm&utm_campaign=nov
- https://blog.wishpond.com/? utm_source=sbmking &utm_medium=cm&utm_campaign=nov
Use your UTM codes, with a link shortener to easily track campaigns and A/B test your social updates.
You can use UTM codes to track campaigns through Google Analytics, or in bitly. I like using the bitly links for a quick look at how I’m doing. Use Google Analytics for more comprehensive UTM tracking code data.
Social Media Platform Metrics
Social media platforms have analytics directly within their sites. Use them to measure to your engagement levels on each site.
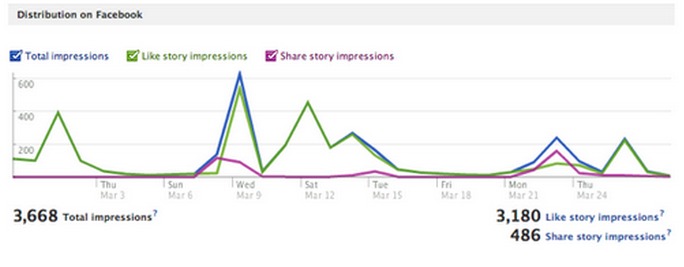
Facebook Insights
Use your Facebook Insights to measure metrics like:
- Reach of each post
- Total engagement per post – total of all likes, share and comments
- Total Impressions per post
Twitter Analytics
New!
Twitter has now opened its analytics for any Twitter use to access.
Prior to this, you could get tons of Twitter analytics from sites like Twitilyzer, twitonomy, and followerwonk.
Use Twitter analytics to measure blog post metrics like:
- Total engagement per update
- Potential reach per update
- Click throughs to your blog post
Pinterest Analytics
Use your Pinterest analytics to measure:
- Total visits to your blog site from Pinterest
- Total post reach
- Total Pins from your blog site
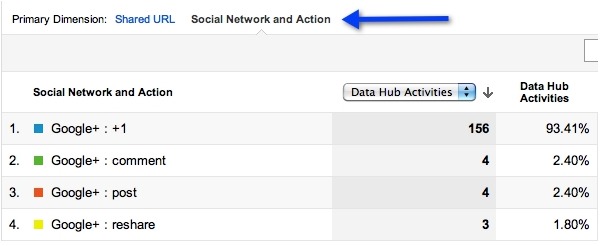
Google+ Analytics
Use your analytics on Google Plus to measure:
- Total public shares – with Google+ Ripples
- Total engagement per post – total of all +1’s, shares and comments
- Total +1 Shares on your blog post
Inbound Marketing ROI and Continuous Improvement
The most important aspect of analytics is to make sure that you’re using them. You need to track your results to determine your ROI, and to continuously improve your content marketing strategies.
Monitor the results of your KPIs daily, weekly, monthly and quarterly. Create reports so that you, and your team, so can determine where to spend more resources, and what content works best where. Then show your awesome results to your boss!
You can export your Google data reports into a shareable Google spreadsheet, or an Excel document:
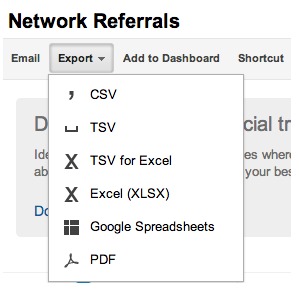
Improve your strategies, based on your results. Measure the changes you made. If they improve overall blog traffic – keep doing it.
Keep tweaking, measuring and improving your results.
Spend the time to measure the resources you’re using for each inbound marketing tactic. Make a weekly report, for example, to prove the effectiveness of each social site you are using to drive traffic to your site. Do a cost/benefit analysis, if you need to.
For example, if you’re spending 1 hour a day engaging on Facebook, and 2 hours on Quora, that’s great. But check your Social Network Referrals to make sure that time/ cost is getting you the benefits/ profit you need.
Conclusion
There are tons of analytics you can use to get better results for your content marketing – and business. Make the effort to learn the tools that work best for you – and then use them!
You’ll improve your business bottom line, and your boss might even give you a raise for your success!
Read more methods to drive drive traffic to your blog:
- 10 Tips: How to Use LinkedIn to Drive Traffic to Your Blog
- 12 Effective Ways to Use Facebook to Drive Traffic to Your Blog
- 12 Formulas: How to Use Twitter to Drive Traffic to Your Blog
- How to use Google+ to Promote your Blog (9 tips)
- 9 Ways to Use Pinterest to Drive Traffic to Your Blog
- 12 Tips: How to Use Email to Drive Traffic to Your Blog
- The Ultimate Small Business Guide to Social Bookmarking: Driving Traffic to Your Blog
- Blog Traffic: How to Use Q&A Sites and Niche Forums to Increase Blog Visitors
- Influence Marketing: How to Find Your Industry Leaders
- 7 Ways to Use Predictive Content Analytics
What do you think? How do you measure your analytics? Have you improved your ROI by using metrics strategically? Do you use Google Analytics, or do you use bitly? Let us know in the comments, below.