
TikTok is a relatively new social media platform that witnessed explosive growth in the last two years. It is particularly popular among younger audiences, with one billion million active users worldwide.
What’s more, it is the most downloaded app on the Apple App Store and users spend an average of 52 minutes per day on the app, engaging with content from individuals and businesses alike.
Clearly, TikTok marketing can add a huge boost to your business’s social media marketing efforts. However, if you’re new to this platform, using it correctly and being sure about what’s working and what’s not can be tricky.
That’s where TikTok’s built-in analytics comes in. With it, you can target the right audiences and really understand what makes them tick. Analytics can take a lot of the guesswork out of your content strategy, enabling you to understand everything from what to post and when.
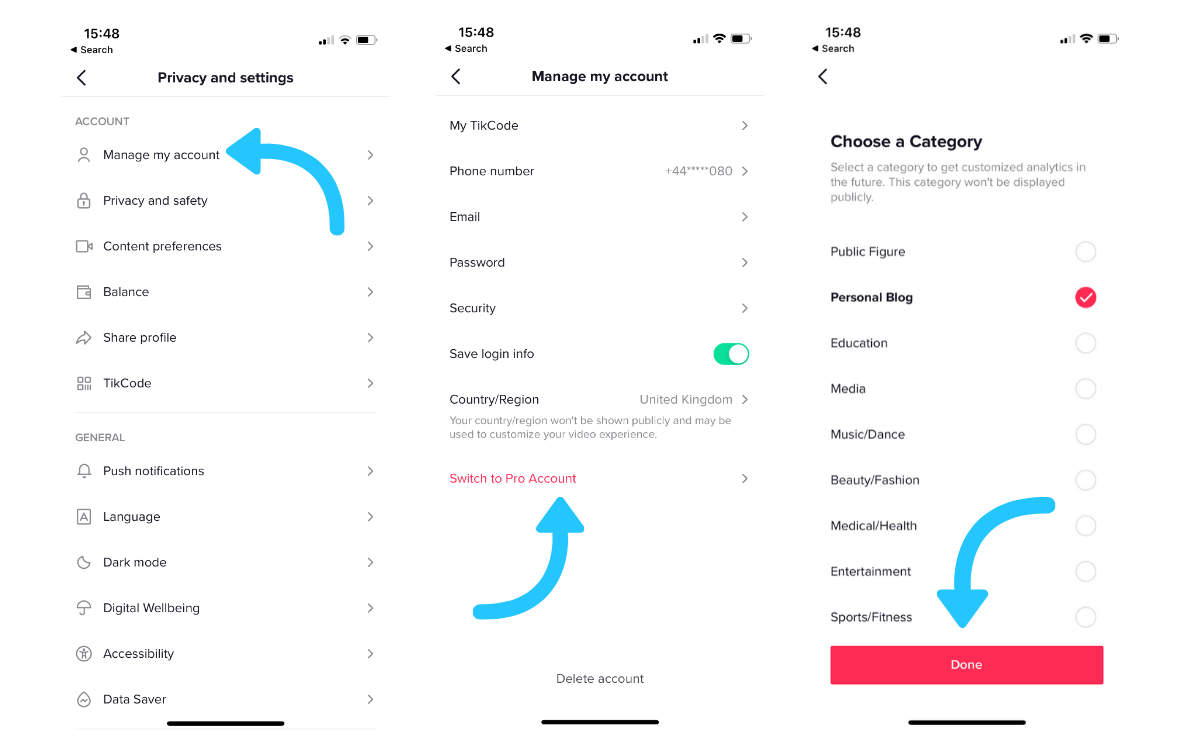
Keep in mind that you’ll need to switch to a Pro account (it’s free) to gain access to TikTok analytics. Here’s how:
- From your profile page, open the Privacy and settings tab.
- Choose “Manage My Account.”
- Tap “Switch to Pro Account” and follow the steps from there.
- Choose your business industry (won’t be displayed publicly).
- Done.
Your TikTok will now reload a Pro Account with Analytics. Once you click on that, you’ll find three tabs — Overview, Content, and Followers. Let’s see each of them in detail along with some best practices on how to leverage them for your business.
TikTok Overview Analytics
When you first open your TikTok analytics, on desktop or mobile, you see the Overview tab. This tab shows you high-level data on your Video Views, Followers, and Profile Views for the last 7 days.
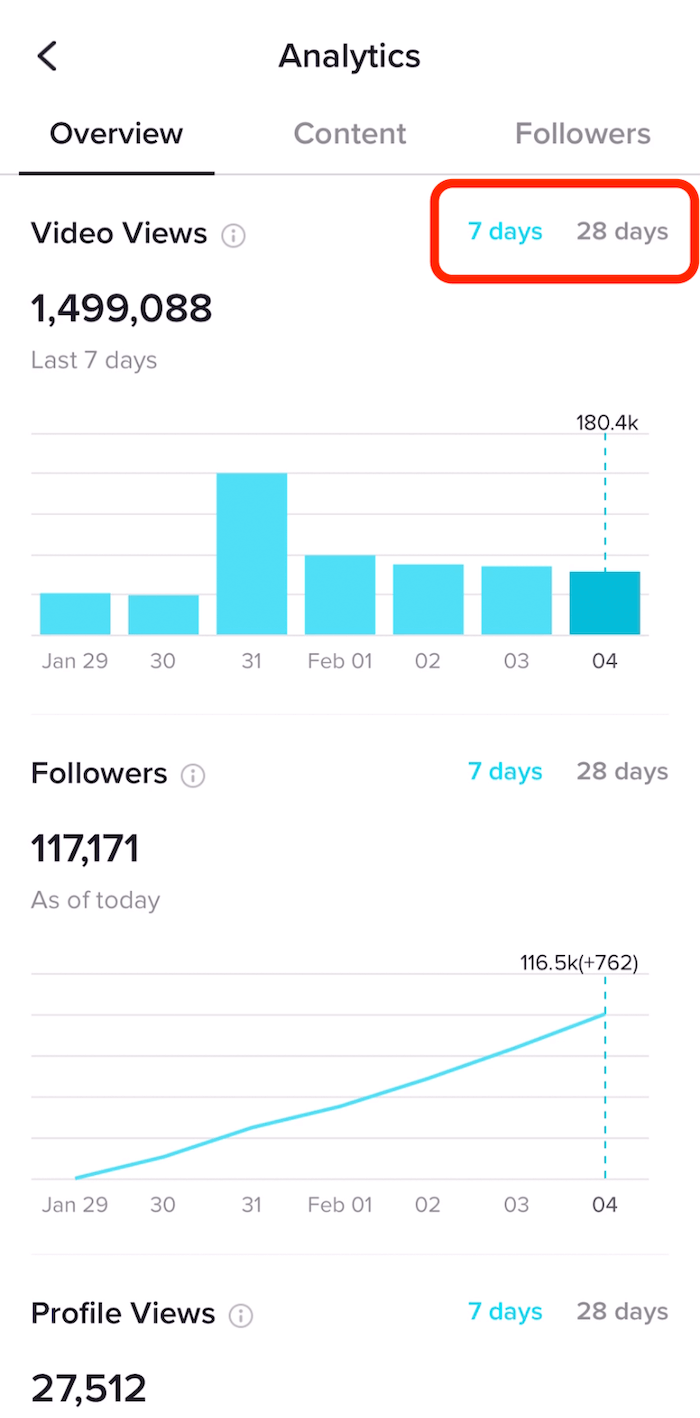
You can switch to 28 Days to analyze your month’s performance. On a desktop, you can download a CSV file of your data for safekeeping.
Now, there are three metrics to track on your account dashboard.
1. Video Views
The total number of times your account’s videos were viewed over a given period.
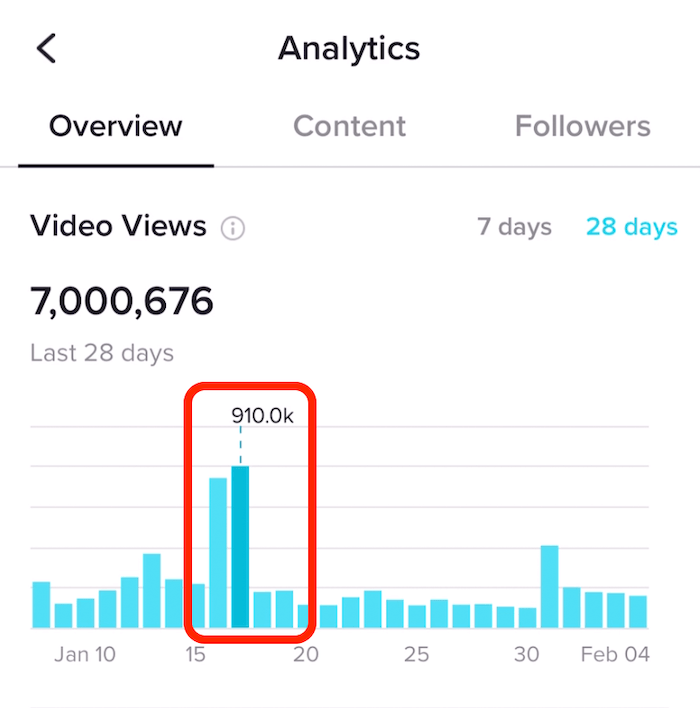
How to use it for your business: If you had notably more video views on some specific day(s), check what type of video caused that burst in views and how you can emulate that success in your future content.
2. Followers
The total number of TikTok users that follow your business account.
See your past week’s or month’s trend to analyze the pace at which your follower count is growing. Even if you had a video go viral, it doesn’t necessarily translate to more followers.
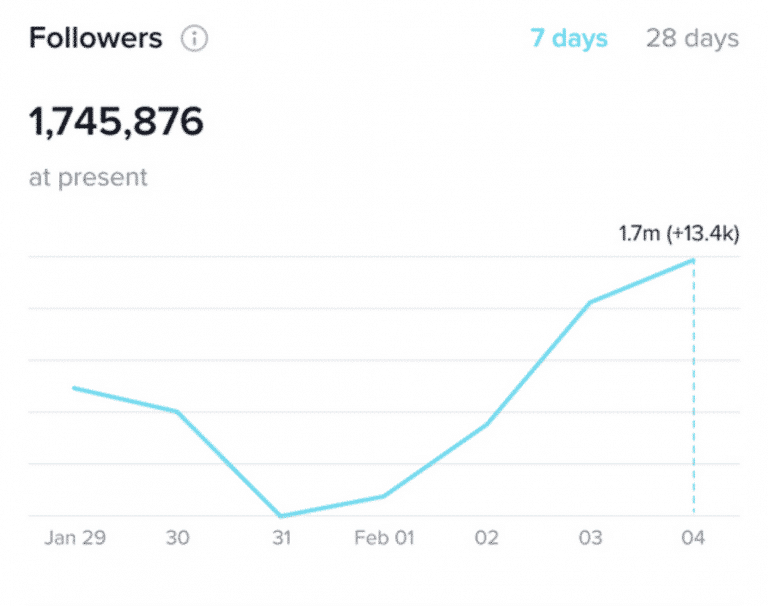
How to use it for your business: Your follower growth trend can help you determine which content format is working well for your business. So if during the last seven days, the follower growth trend is rising sharply, review what you posted and repeat that formula for future content.
3. Profile Views
The number of times your business profile was viewed over a given period.
This metric is a good indication of brand interest, as it measures the number of people who liked your content enough to check out your profile, and the people who are curious to see what your business is up to on this relatively new platform.
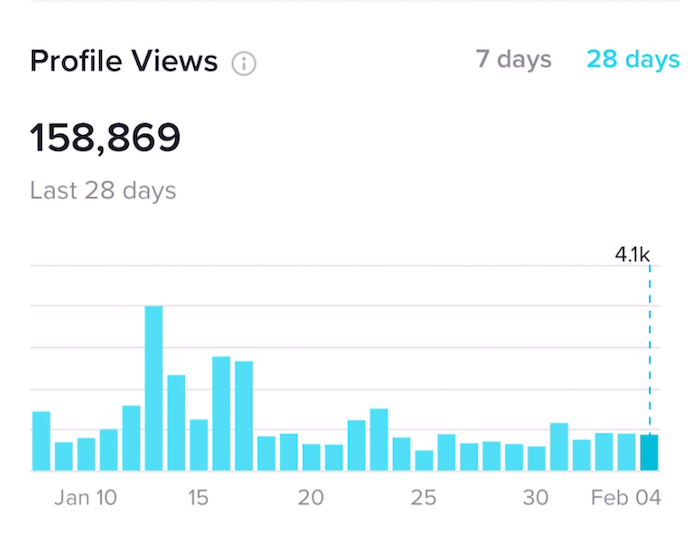
Moreover, these views are most likely to turn into followers.
How to use it for your business: This metric can help you figure out whether your content efforts on this platform are actually attracting people to your business. So, keep an eye out for the number of people checking out your profile to gauge brand interest.
Need help growing your social media following?
Book a free call to learn how our team of marketing experts can help you to grow on social media and boost your sales.
TikTok Content Analytics
Let’s switch over to the Content tab that gives you valuable insights on the performance of your video posts and trending videos.
These metrics help you understand what videos your followers are engaging with most, your most popular content, and more. Let’s dive in.
1. Video Posts
This section shows all of the TikTok video posts you’ve published in the last 7 days with the fastest growth in views. Listed on the thumbnail of each video is the current view count for that video.
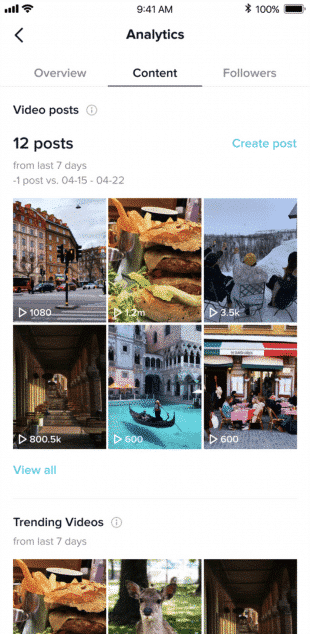
If you didn’t post anything in the last 7 days, you’ll see an empty dashboard, prompting you to post more.
You can click on a video to see its individual metrics such as the total likes, comments, shares, traffic source, audience demographics, and more. You can also see the total and average time watched.
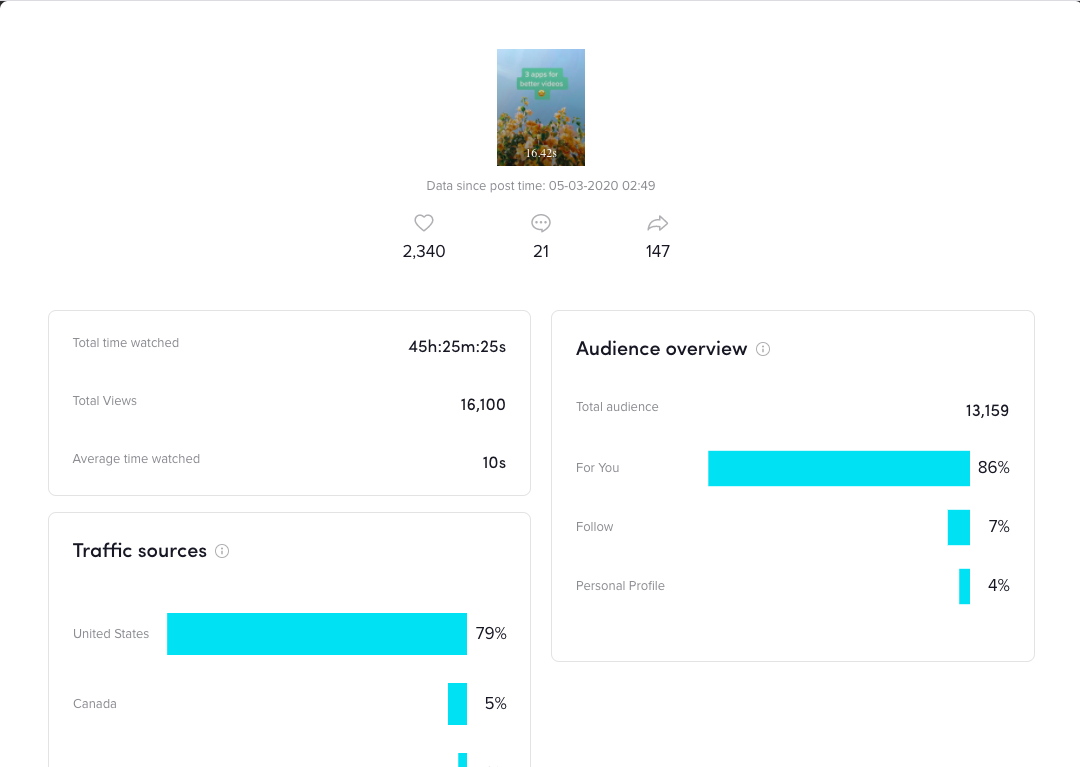
Furthermore, your audience overview tab tells you how your audience found your content. In the above example, 86% of the total audience was from the For You page.
How to use it for your business: Use your views and time watched metrics to set your own benchmarks for continuous growth. By looking at the top traffic sources, you can adjust your content strategy to appeal to a particular country’s audience.
2. Trending Videos
This section shows your videos that have been trending in the last 7 days and the total number of views those videos have amassed to date.
How to use it for your business: See all of your trending videos and find out if they have anything in common. For instance, did you cover the various aspects of a particular topic? Was the format of those videos similar? Try to find a pattern across your trending videos to capitalize on for future content.
TikTok Followers Analytics
The last tab in your TikTok Analytics gives you an impressive data visualization about your followers, from their gender and where they live to when they’re active on TikTok, and what other videos and sounds are popular among them.
Thus, the Followers tab can be a great source for content inspiration. Let’s go.
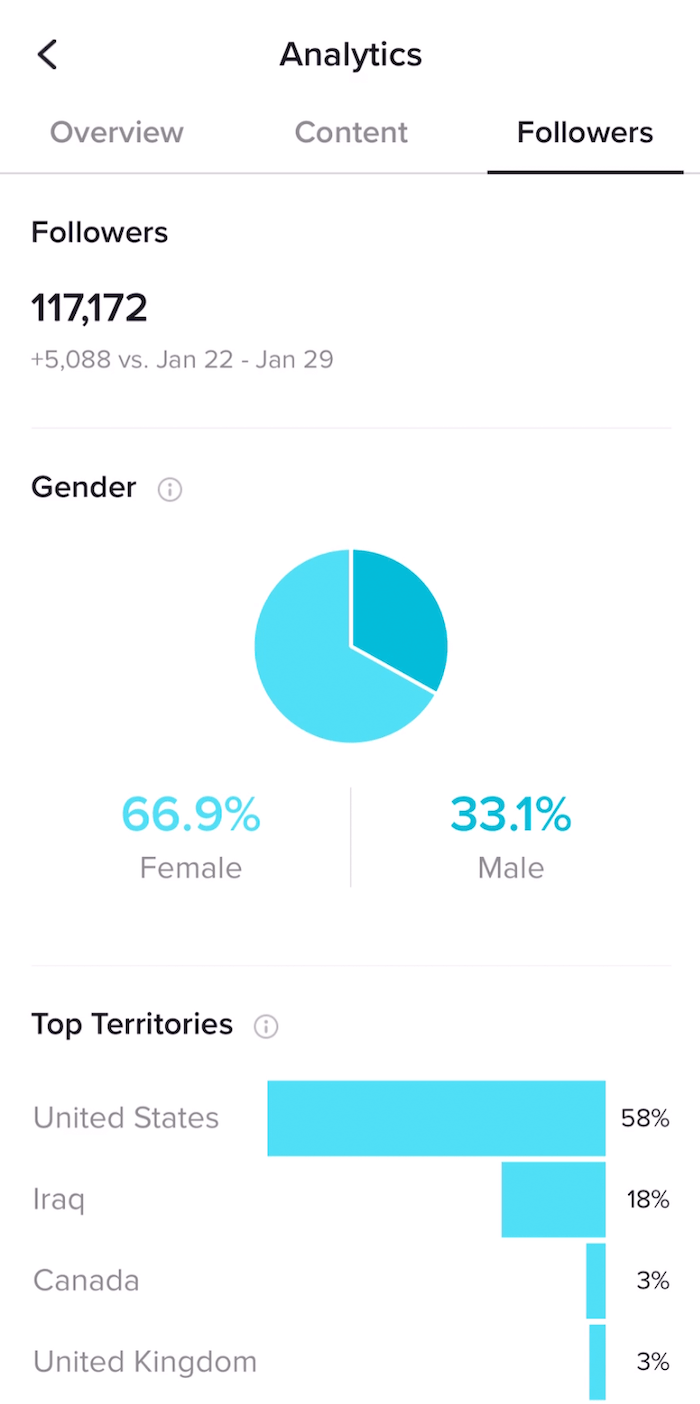
1. Followers
The follower count shows you how many total followers you have and the increase or decrease in followers over the last 7 days.
How to use it for your business: Look out for the change in followers for your business account once a week to see if your content strategy is helping or hurting your follower growth. If the follower count is going down, you obviously need to revise your strategy to keep up with the latest trends and interests.
2. Gender
This is the breakdown of your followers by their gender.
How to use it for your business: Unless your business sells products for a specific gender, to grow your audience, consider creating content that appeals to all genders. Also, consider partnering up with a relevant influencer to gain exposure with different types of audiences.
3. Top Territories
This gives you a breakdown of your followers by country. This can help you understand whether you’re effective in reaching your target country’s population.
How to use it for your business: For instance, if you’re an eCommerce cosmetics brand based in New York, ideally you’d like to have a majority female audience with the US as your top territory.
If this is not the case, it’s a good idea to rethink your content strategy (say, by creating more location-specific content) to reach the follower demographic you need for your business.
4. Follower Activity
This shows you the times and days that your followers are most active on TikTok, so if you’re wondering what the best time to post is, here you have the answer.
How to use it for your business: Look for time slots when activity is consistently high, and aim to post those time slots for the best possible content engagement.
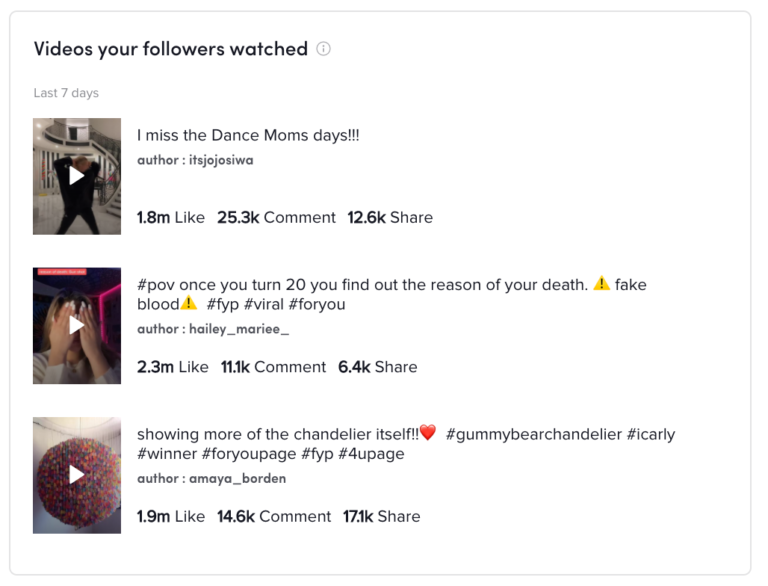
5. Videos Your Followers Watched
In this section, you can see the other TikTok videos that are popular with your followers. It gives you the performance metrics (likes, comments, and shares) for the three top posts each week, along with the captions and TikTok hashtags used by these top videos.
How to use it for your business: Look at these videos to get an idea of what resonates with them. As these video trends move fast, come up with quick content along those lines by using bits from stock videos and your own raw footage.
This is also a good place to hunt for some potential partnerships.
6. Sounds Your Followers Listened To
Lastly, you can also see what are the top sounds your followers are using and have listened to. This may help you create a trending video that incorporates these sounds.
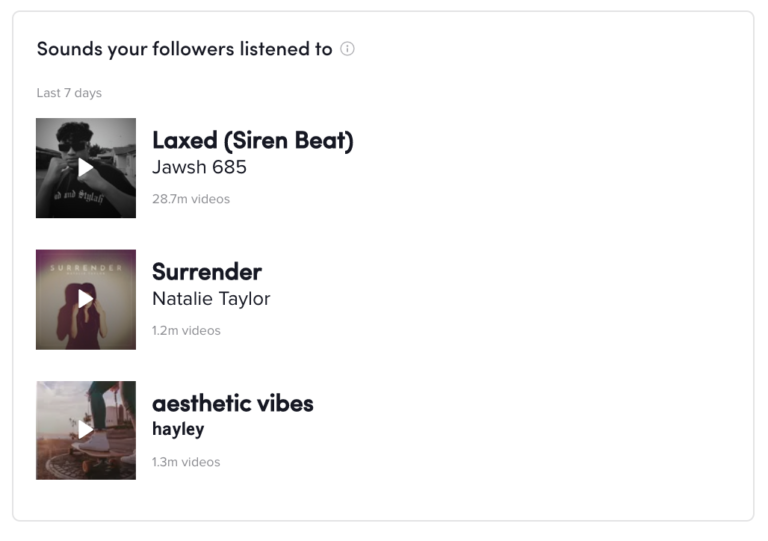
How to use it for your business: Save these songs to your Favorites by tapping on the song and pressing the bookmark icon so you can later use them to create engaging content. Make sure to listen to the full audio as these sounds often contain inappropriate words.
Over to You
Armed with all the basics of TikTok Analytics and how to make use of each tab, it’s time to dive into your account’s Analytics and optimize your content strategy based on data-driven insights.
To summarize:
- Start by switching over to a Pro account to enable analytics.
- Use the metrics in the Overview tab to determine which content format is working well for your business and whether your videos are attracting people to your business profile.
- Use the Content tab to set benchmarks for continuous growth and to find patterns across your trending videos, which you can then use to create future content.
- Use the data visualization in the Followers tab to learn more about your audience, from their gender distribution to where they live and when they’re most active on TikTok. Take a note of what other videos and sounds are popular among them, and then try to create content along those lines.
Long story short, track your performance on a weekly basis, set benchmarks based on these metrics, and leverage your followers’ activity to make your brand stand out on TikTok. Whether you want to go viral on TikTok or run a successful TikTok ads campaign, keeping an eye on your analytics is essential.
Related Articles
- How to Use TikTok Ads: The Ultimate Guide for Small Businesses
- 7 Amazing TikTok Stats That Prove Why Brands Should Start Using It
- The Biggest TikTok Trends for Businesses to Use in 2022
- 3 Ideas for TikTok Contests to Drive Engagement
- 6 Small Business TikTok Success Stories
- 11 TikTok Hacks For Businesses
About the Author

Gaurav Belani is a senior SEO and content marketing analyst at Growfusely, a content marketing agency specializing in content and data-driven SEO. He has more than seven years of experience in digital marketing. He likes sharing his knowledge in a wide range of domains ranging from marketing to human capital management. His work is featured in several authoritative business publications.